Online Learning Statistics 2026 - Key Facts and Trends
Since the year 2000, the online learning market has grown by an astonishing 900%, transforming from a niche alternative into a central pillar of modern education. For parents and teachers in 2026, these aren't just market figures - they represent a fundamental shift in how children access knowledge, how schools operate, and how we must advocate for quality in a digital-first world. This report breaks down the latest data on virtual schooling, student performance, and the digital divide to help families make informed decisions.

Key Takeaways
- The online learning market has grown 900% since 2000 and is projected to reach $400 billion by 2026.
- Full-time K-12 virtual school enrollment remains near 579,000, almost double pre-pandemic levels.
- Retention rates for e-learning can be 25-60%, significantly higher than the 8-10% for face-to-face learning.
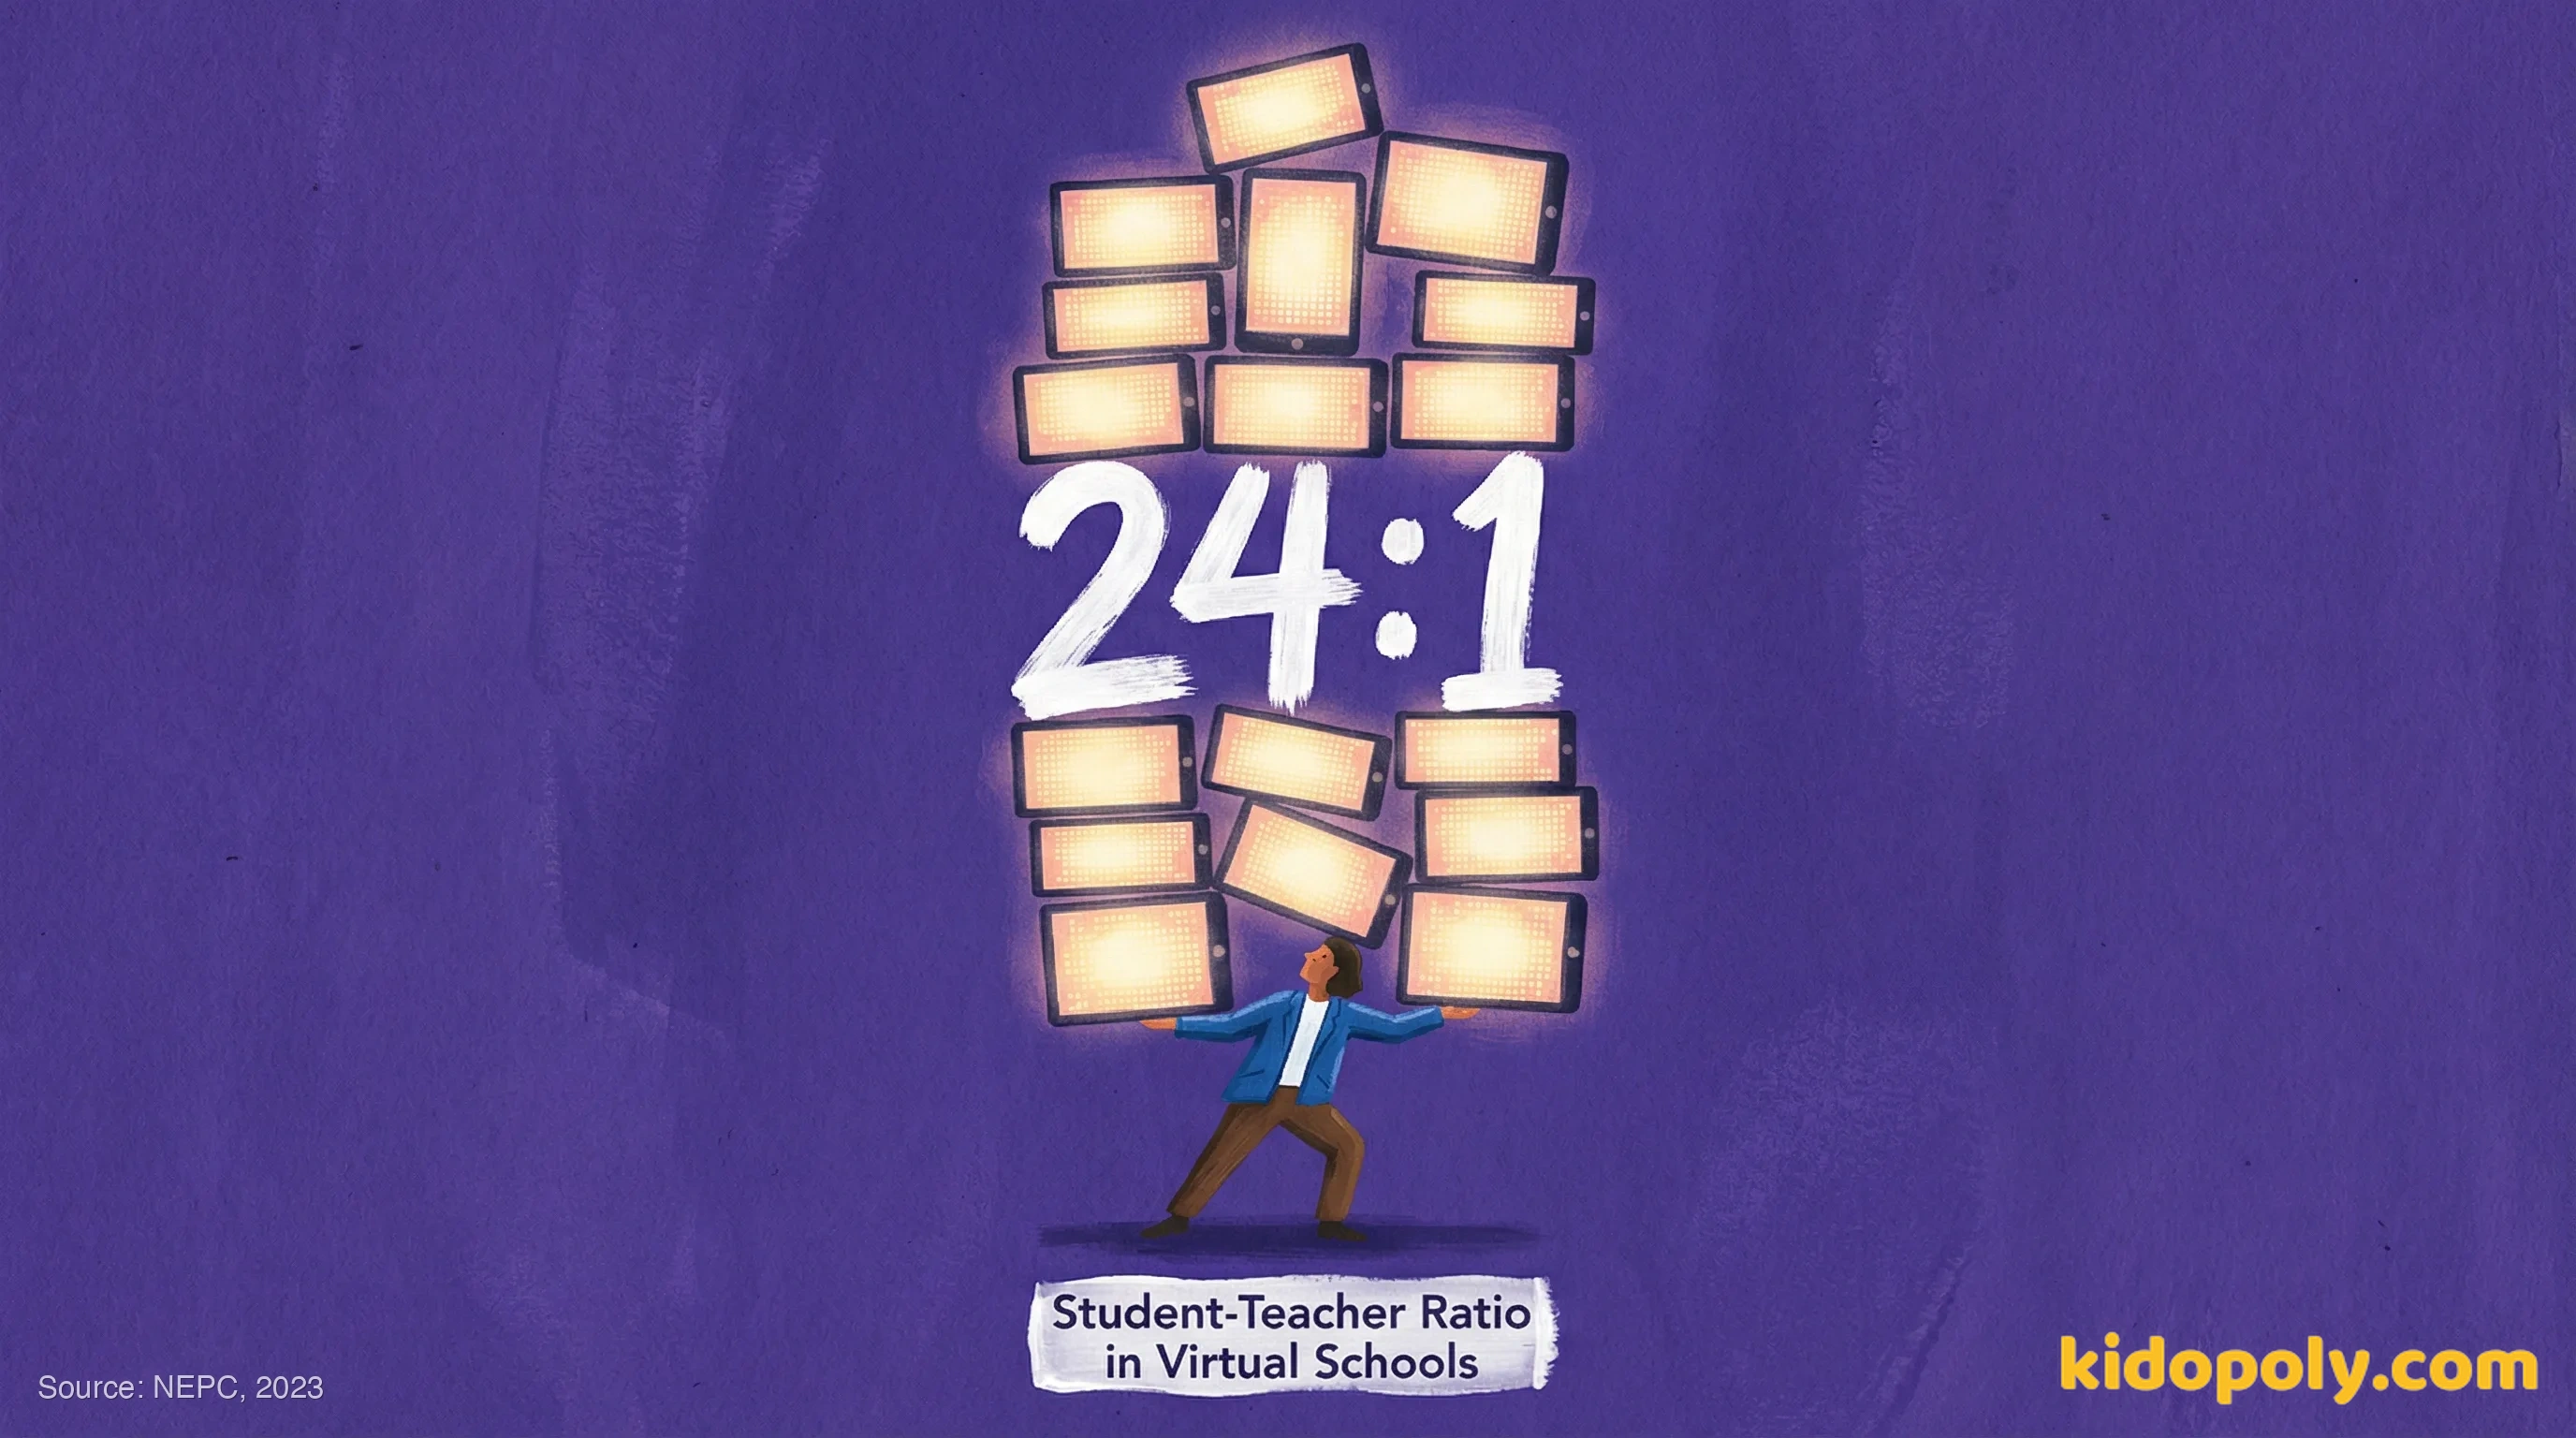
- Virtual schools face challenges with a 24:1 student-teacher ratio, compared to 15:1 in traditional schools.
- A digital divide persists, with only 65.8% of low-income households having adequate access to online learning resources.
The Big Picture: Scope and Growth
Growth in the online learning market since 2000
The sector has expanded nine-fold over two decades, becoming the fastest-growing market in the education industry.
Source: DemandSage (2025)
Projected Market Value of Online Learning
| Metric | Value | Timeline |
|---|---|---|
| Global Industry Value | $400 Billion | By 2026 |
| US Market Value | $687 Billion | By 2030 |
| Global Users | 1 Billion | By 2029 |
Source: Coursebox AI (2026)
K-12 Virtual Schooling: Enrollment & Performance
Students enrolled in full-time virtual schools (2021-22)
Enrollment dropped by 65,000 from the pandemic peak but remains nearly double pre-pandemic levels.
Pass Rates: Virtual vs. Non-Virtual Coursework (Michigan)
Student-Teacher Ratios in Public Schools
| School Type | Students Per Teacher |
|---|---|
| Virtual Schools | 24.4 |
| Traditional Public Schools | 14.8 |
Efficiency and Retention: The 'Superpower' of E-Learning
Information retention rate for online learning
Significantly higher than the 8-10% retention rate typically seen in traditional face-to-face training.
Source: Research.com (2026)
Course Completion Rates by Format
Source: Coursebox AI (2026)
The Human Impact: Access and Equity
Access to Online Learning Resources by Household Income
| Household Income Level | Access Rate |
|---|---|
| High-Income Households | 85.8% |
| Low-Income Households | 65.8% |
Source: Magnet ABA (2025)
Learners reporting digital fatigue
A majority of students report loss of interest or exhaustion from prolonged screen-based learning.
Source: Coursebox AI (2026)
Common Questions from Families
Is online learning actually effective for children?
How popular are virtual schools now that schools are open?
Does my child get enough attention in a virtual school?
Are colleges and employers accepting online degrees?
What is the biggest challenge for kids learning online?
Taking Action: What Families & Educators Can Do
What Parents Can Do
- Check the student-teacher ratio before enrolling; aim for schools that beat the 24:1 virtual average.
- Combat 'digital fatigue' by scheduling offline breaks - 67% of learners struggle with screen exhaustion.
- Supplement virtual coursework with in-person social activities, as virtual schools often have less peer interaction.
What Educators Can Do
- Focus on 'active learning' techniques; simply digitizing lectures leads to lower pass rates (65% vs 72%).
- advocate for closing the access gap; 65.8% of low-income families have access issues compared to 85.8% of high-income families.
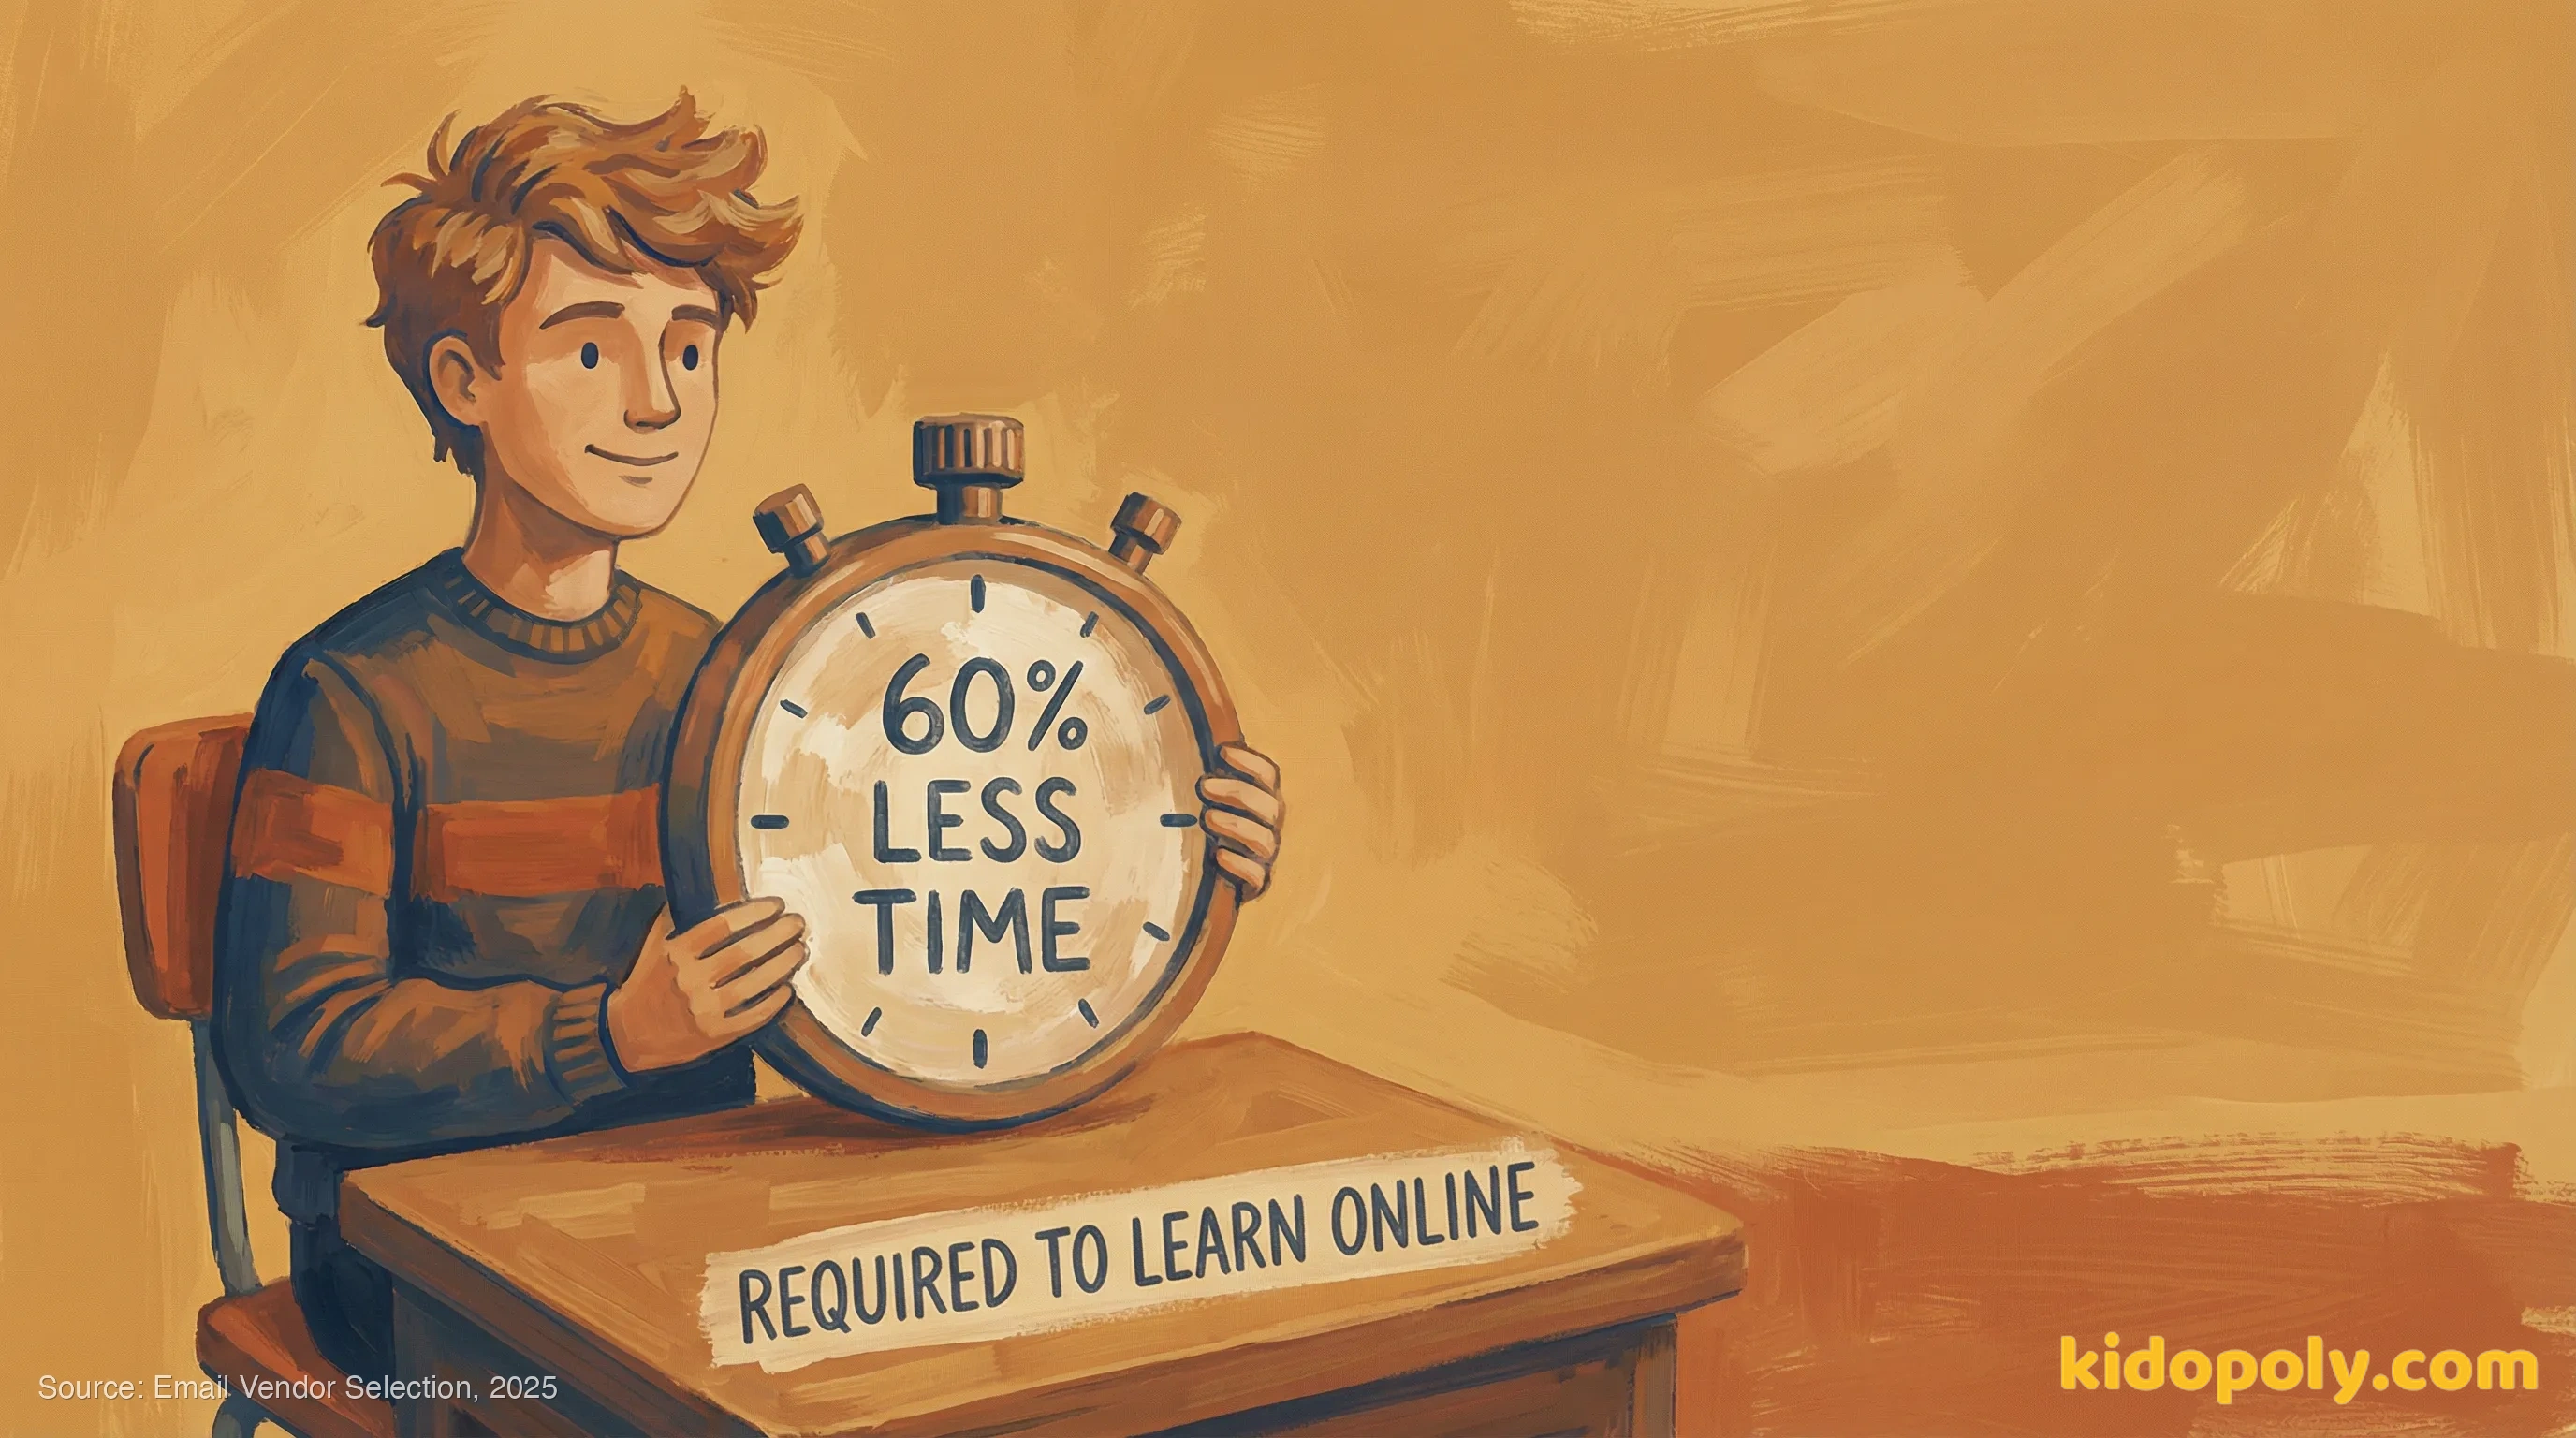
- Leverage the efficiency of e-learning (40-60% time savings) to free up time for mentorship and 1-on-1 support.
Sources (15)
- 1.
- 2.
- 3. National Education Policy Center (NEPC) (2023) https://nepc.colorado.edu/publication/virtual-schools-annual-2023
- 4. Michigan Virtual Learning Research Institute (2024) https://michiganvirtual.org/research/publications/michigans-k-12-virtual-learning-effectiveness-report-2022-23/
- 5.
- 6.
- 7.
- 8.
- 9. National Center for Education Statistics (NCES) (2022) https://nces.ed.gov/fastfacts/display.asp?id=80
- 10.
- 11.
- 12.
- 13.
- 14. EdTech Magazine (2021) https://edtechmagazine.com/k12/article/2021/06/rise-virtual-only-k-12-schools
- 15.